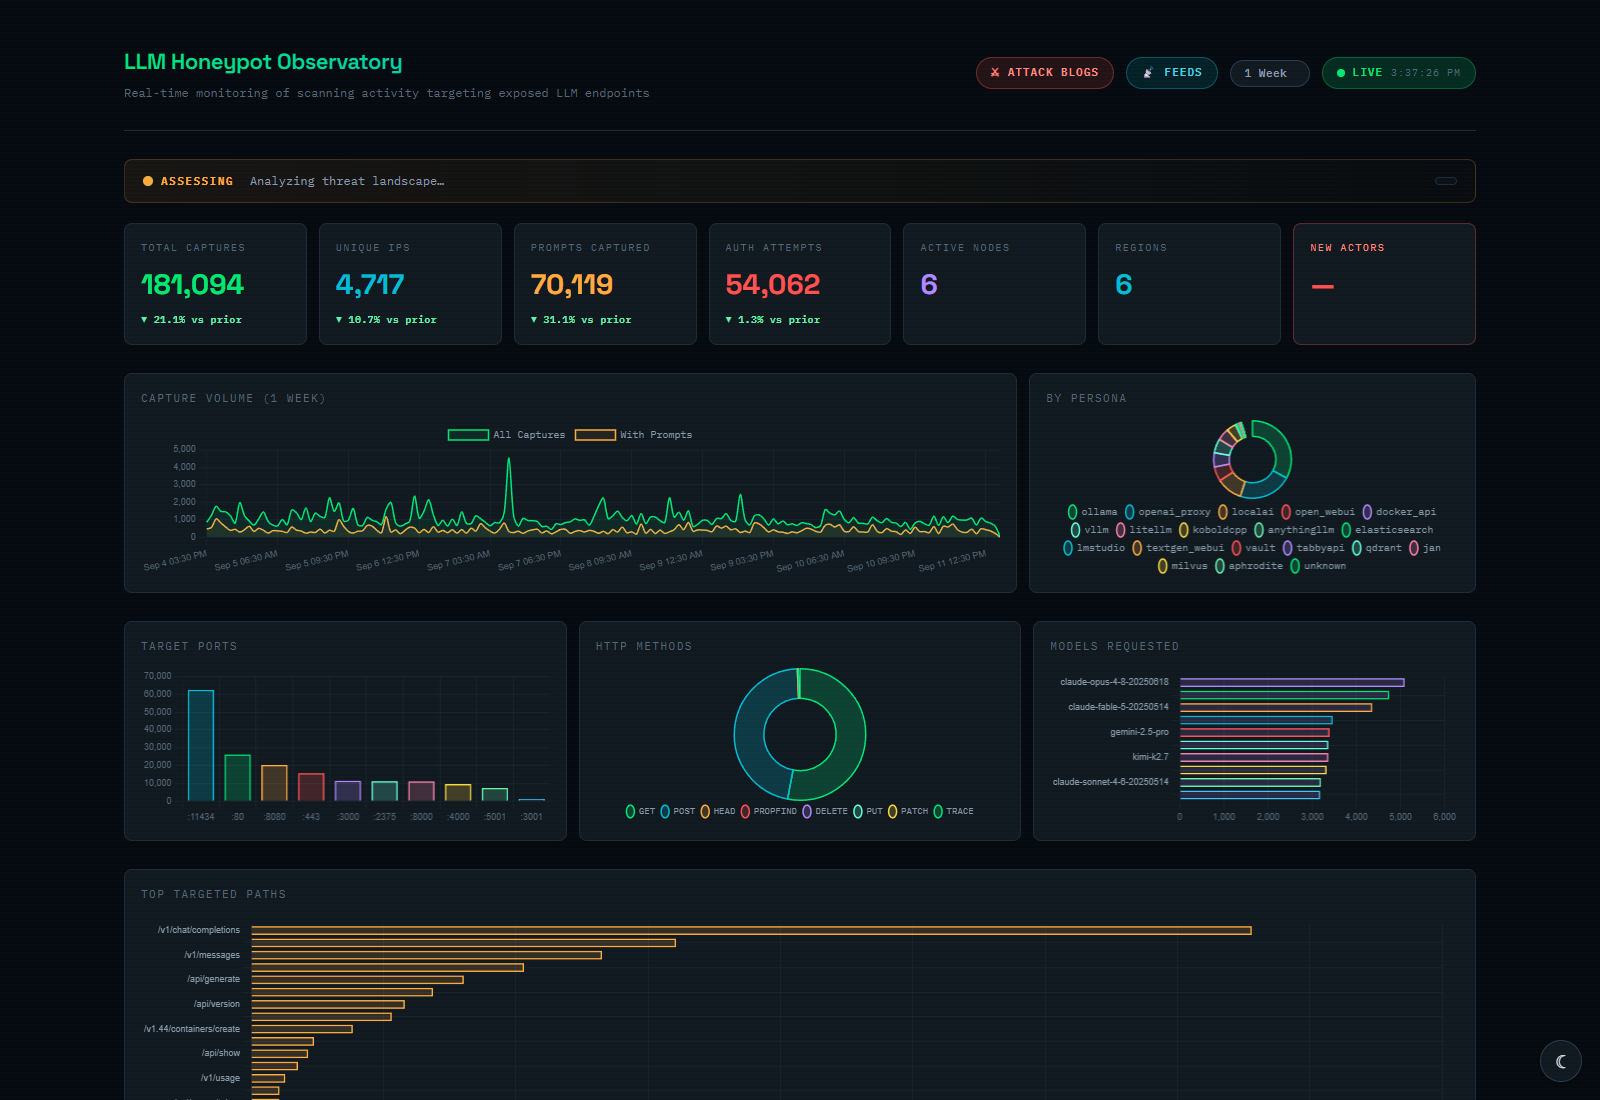
Put a server on the internet and give it nothing to protect, and something will still come knocking. Usually it is a script, not a person. It checks a few ports, tries a handful of familiar web addresses, and moves on. Sometimes it goes further: it tries a password, asks for a configuration file, or sends a prompt to what looks like an AI model.
A honeypot is how we get to watch that happen on purpose. It is a decoy that looks like a useful service, but its real job is to write down every interaction so we can understand it afterward. Nobody legitimate has any reason to touch it, which is exactly what makes the things that do touch it worth reading.
This is the first of two posts, the beginner's on-ramp. By the end you will know what a honeypot records, why an AI one is worth building, how to stand one up, and how a pile of raw logs becomes a finding someone can act on. The second post takes months of real traffic our sensors collected and walks through the patterns we found.
The data comes from ai-honeypots.com, a distributed AI honeypot network owned by Eli Woodward, which Eli and I have been building an investigation layer on top of. Handily for a how-to post, its starting point is open source: Eli published the original sensor as the Holiday Honeypot, so the build section below points at real, runnable code.
What is a honeypot, really?#
A honeypot is two things bolted together: something that looks worth interacting with, and a recorder that never stops writing. The classic example is a decoy SSH server. SSH is the protocol people use to log in to remote machines and get a command prompt. A scanner finds the open port, tries a username and password, and gets what looks like a shell. Behind the scenes that shell may be a simulation. Either way, the honeypot has already recorded the login it was handed and every command that follows.
Now the interesting questions have answers. Which password did the visitor try first? What was its very first command? Did another address send the same sequence an hour later? None of that survives on a normal server, which is built to serve customers and quietly drop the noise. A honeypot is built to keep the noise, because the noise is the point.
A honeypot records what a visitor asks for, replies in a controlled way, and hands the record to an analyst. The request is real evidence; the reply is something you chose.
A few words show up throughout, so here is the plain-language version of each:
| Term | What it means here |
|---|---|
| Service | A program that sits and listens for network requests |
| Port | The numbered doorway a service listens on (SSH is usually 22, web is 80 or 443) |
| Endpoint, or route | A specific API address, such as /v1/models |
| Sensor | The decoy-plus-recorder that collects the observations |
| Source IP | The network address a request appears to come from |
| Persona | The identity the decoy presents, for example "I am an Ollama server" |
A honeypot is not a firewall (which decides what traffic is allowed through) and not an intrusion detection system (which watches traffic for suspicious patterns). It creates a target on purpose so the interaction can be recorded in far more detail than either of those would keep.
How realistic does the decoy need to be?#
As realistic as the question you are asking, and no more. This is the single most useful design decision, so it is worth slowing down on. If all you want to know is which web addresses scanners go looking for, a server that says "not found" to everything is plenty, because you still log the address it asked for. If you want to see what a visitor does after it gets in, you need a decoy that convincingly lets it in. People call this the honeypot's interaction level:
- Low interaction. A thin imitation: a login banner, or a few API routes that return canned answers. Great for seeing discovery and first contact. Cheap and safe.
- Medium interaction. A richer illusion, such as a shell session or a multi-step API conversation, so the visitor can go a few moves deeper while the real capabilities stay locked down.
- High interaction. A genuinely real service or operating system, kept inside an isolated lab. It can show actual execution, but now you have a real thing to contain, and that is a much bigger responsibility.
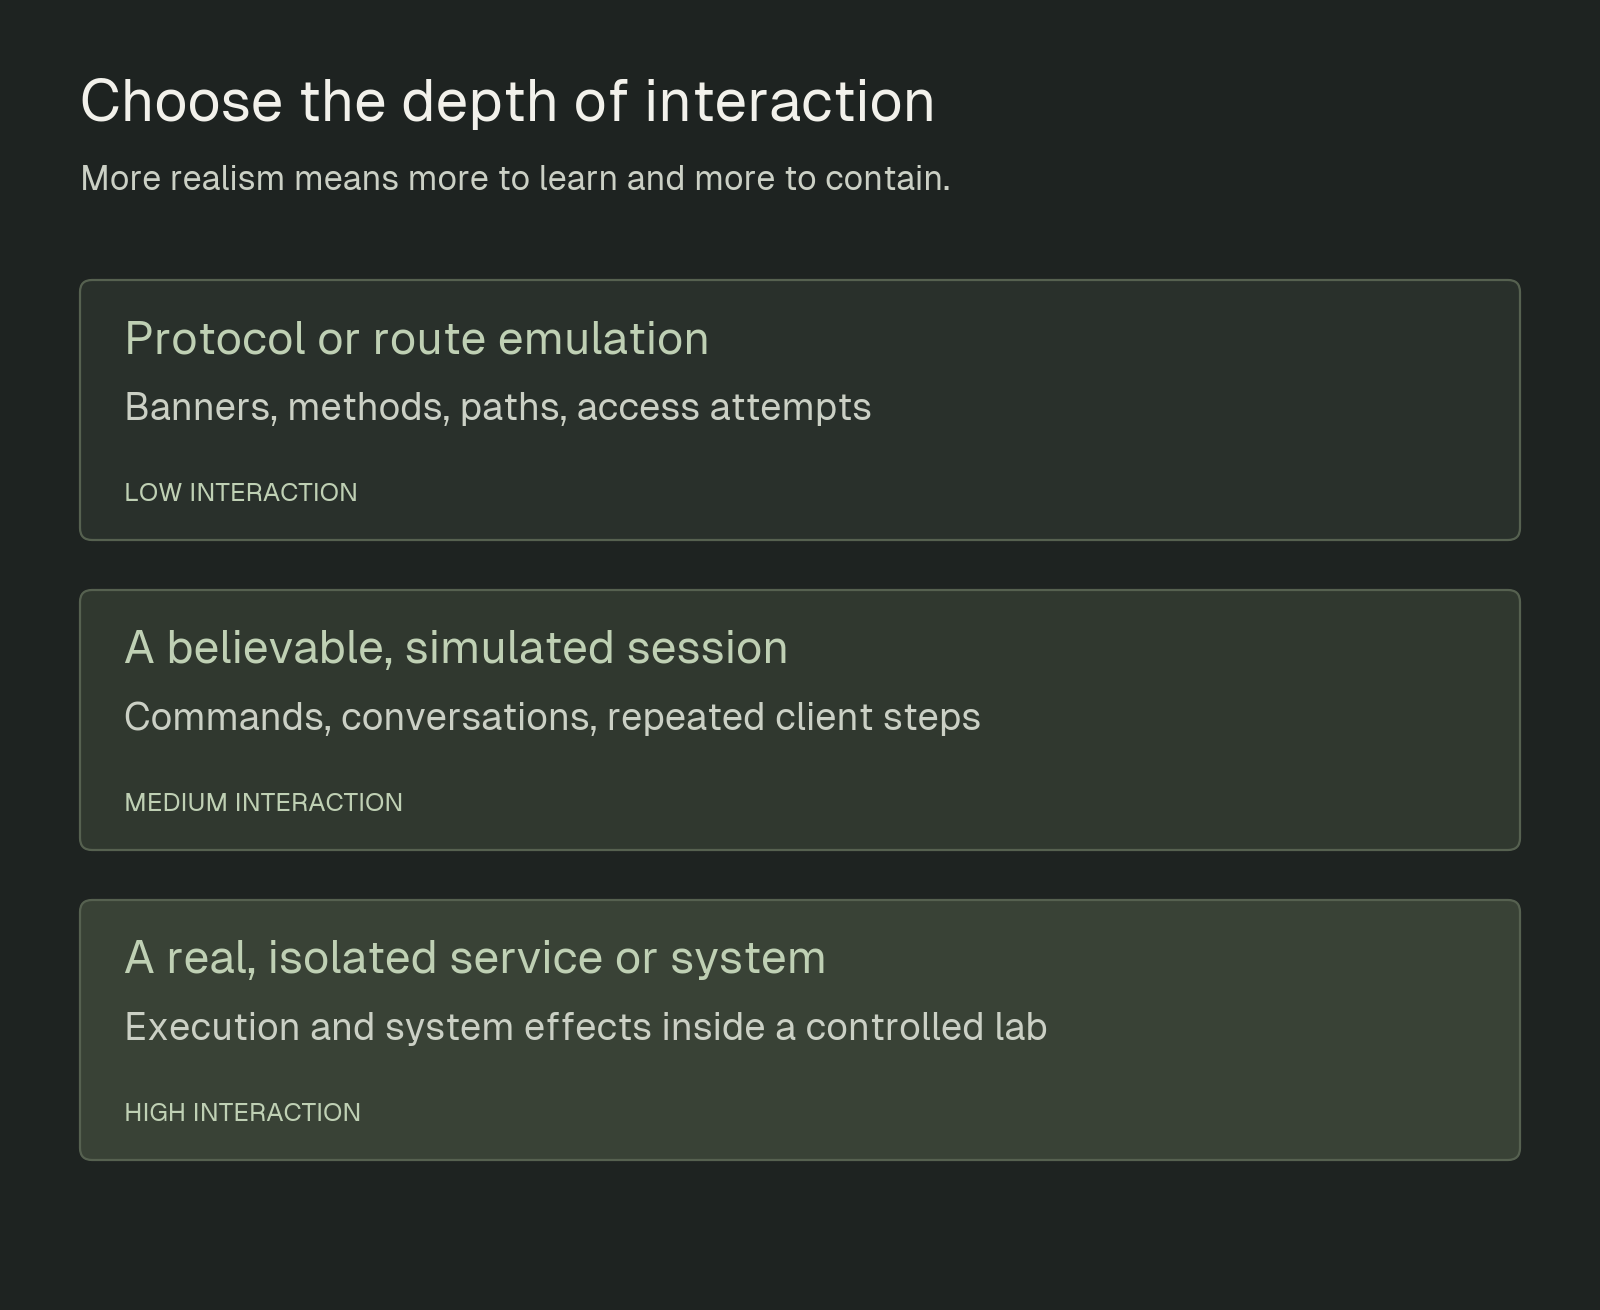
Pick the depth from what you want to learn. More realism means more to learn and more to contain.
Does every request mean an attack?#
No, and getting this wrong is the fastest way to fool yourself. A public sensor sees research scans, misconfigured software, routine health checks, and genuine abuse all mixed together. A lone GET / usually means nothing more than "something found the address." Two things change how much a single event means: placement (an unadvertised decoy file inside a company network is a far louder signal than a random hit on a public server) and your own record-keeping (write down your own tests and approved scanners so you do not mistake your footprints for an intruder's). And every honeypot has a horizon: it only ever sees traffic that reaches it. Some visitors spot the decoy and leave, others never find it. A honeypot is a clear window, not the whole sky.
The honeypots that came before AI#
The idea is decades old, and you do not have to build from scratch. Mature projects cover most of the classic surfaces, and an AI honeypot borrows their design instincts.
| What you want to watch | A well-known option | What it captures |
|---|---|---|
| SSH and Telnet logins | Cowrie | Login attempts, shell commands, transferred files |
| Attacks on network services | Dionaea | Interactions with emulated services and any malware they drop |
| Industrial control systems | Conpot | Discovery and requests aimed at simulated factory-floor protocols |
| Many services in one box | T-Pot | A whole collection of honeypots running together |
| Access to a planted file or credential | Canarytokens | An alert the moment someone touches a decoy item |
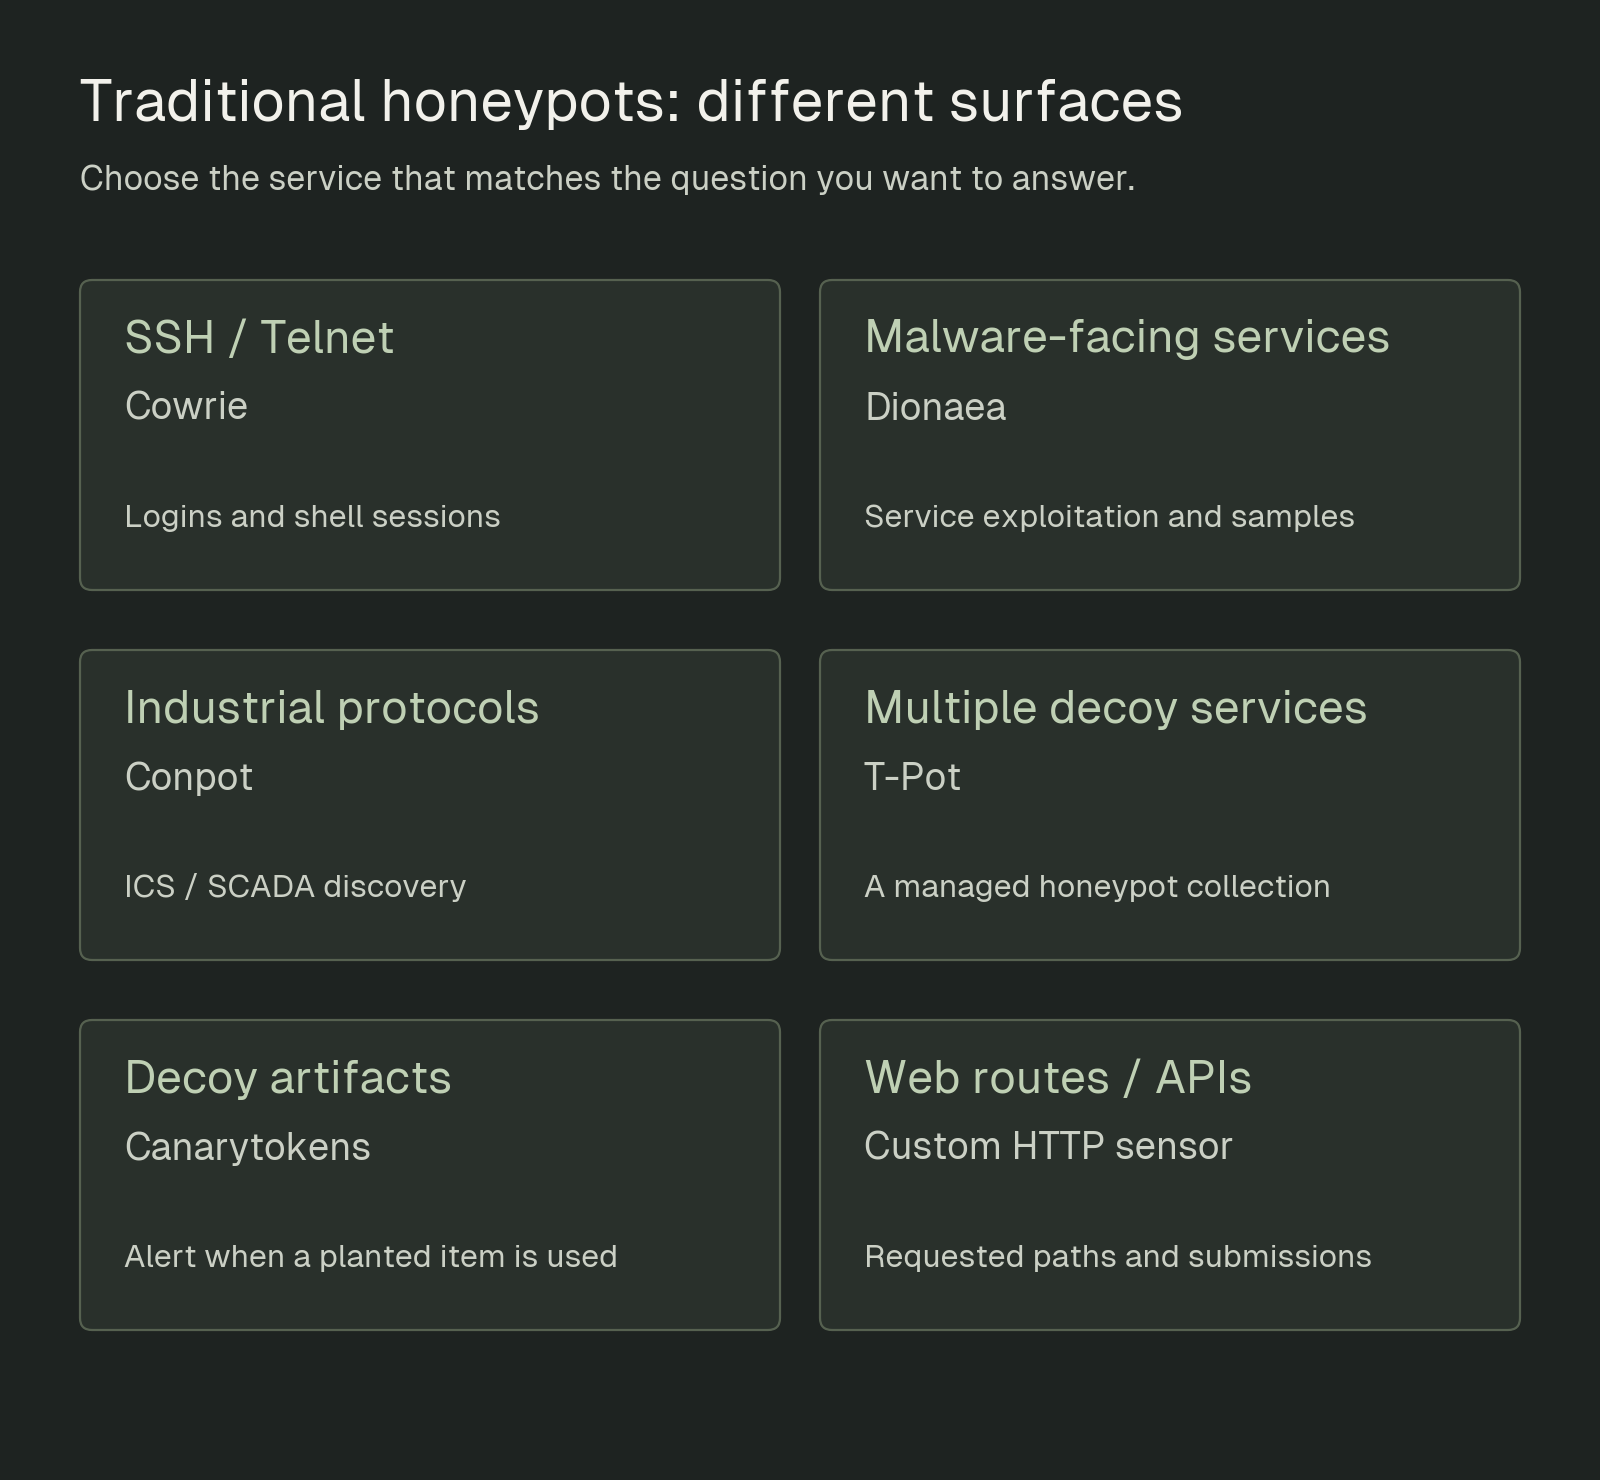
Different services give you different places to stand and watch.
One of those works differently from the rest. A honeytoken (Canarytokens is the friendly version) is not a listening server at all. It is a decoy artifact, a document or a credential-shaped thing, that phones home the instant it is used. Keep that idea in your pocket, because "who touched something they had no honest reason to touch" is the cleanest signal in this entire field.
What makes an AI honeypot different?#
Here is the thing that surprises people: an AI service is still mostly ordinary infrastructure. It runs on hosts with authentication, proxies, configuration files, and APIs, exactly like any other web service. What it adds is a set of AI-specific behaviors: listing available models, accepting prompts, and sometimes reaching out to tools or data through the Model Context Protocol. An AI honeypot imitates those interfaces, which gives you a front-row seat to a new question: what do people ask an apparently-available AI service to do?
There is one naming trap worth clearing up right away, because the two ideas sound identical and mean opposite things:
- An AI-facing honeypot imitates an AI service. The AI is the bait.
- An AI-powered honeypot uses a model to generate its replies. The AI is the engine.
A model pretending to be an SSH terminal is the second kind. The small decoy we build below is the first kind, using fixed replies and no model at all. You can build a convincing AI honeypot without any AI inside it.

Two very different meanings of the same phrase. Keep them apart.
A single request rarely tells the whole story. A well-behaved AI client usually checks which models are available before it sends a prompt: Ollama has one route to list its models and another to chat, while other servers use /v1/models and /v1/chat/completions. A decoy can play along, returning a made-up catalogue and recording the messages that follow. The interesting behavior is often the follow-up, the retry or the switch to a different model name.
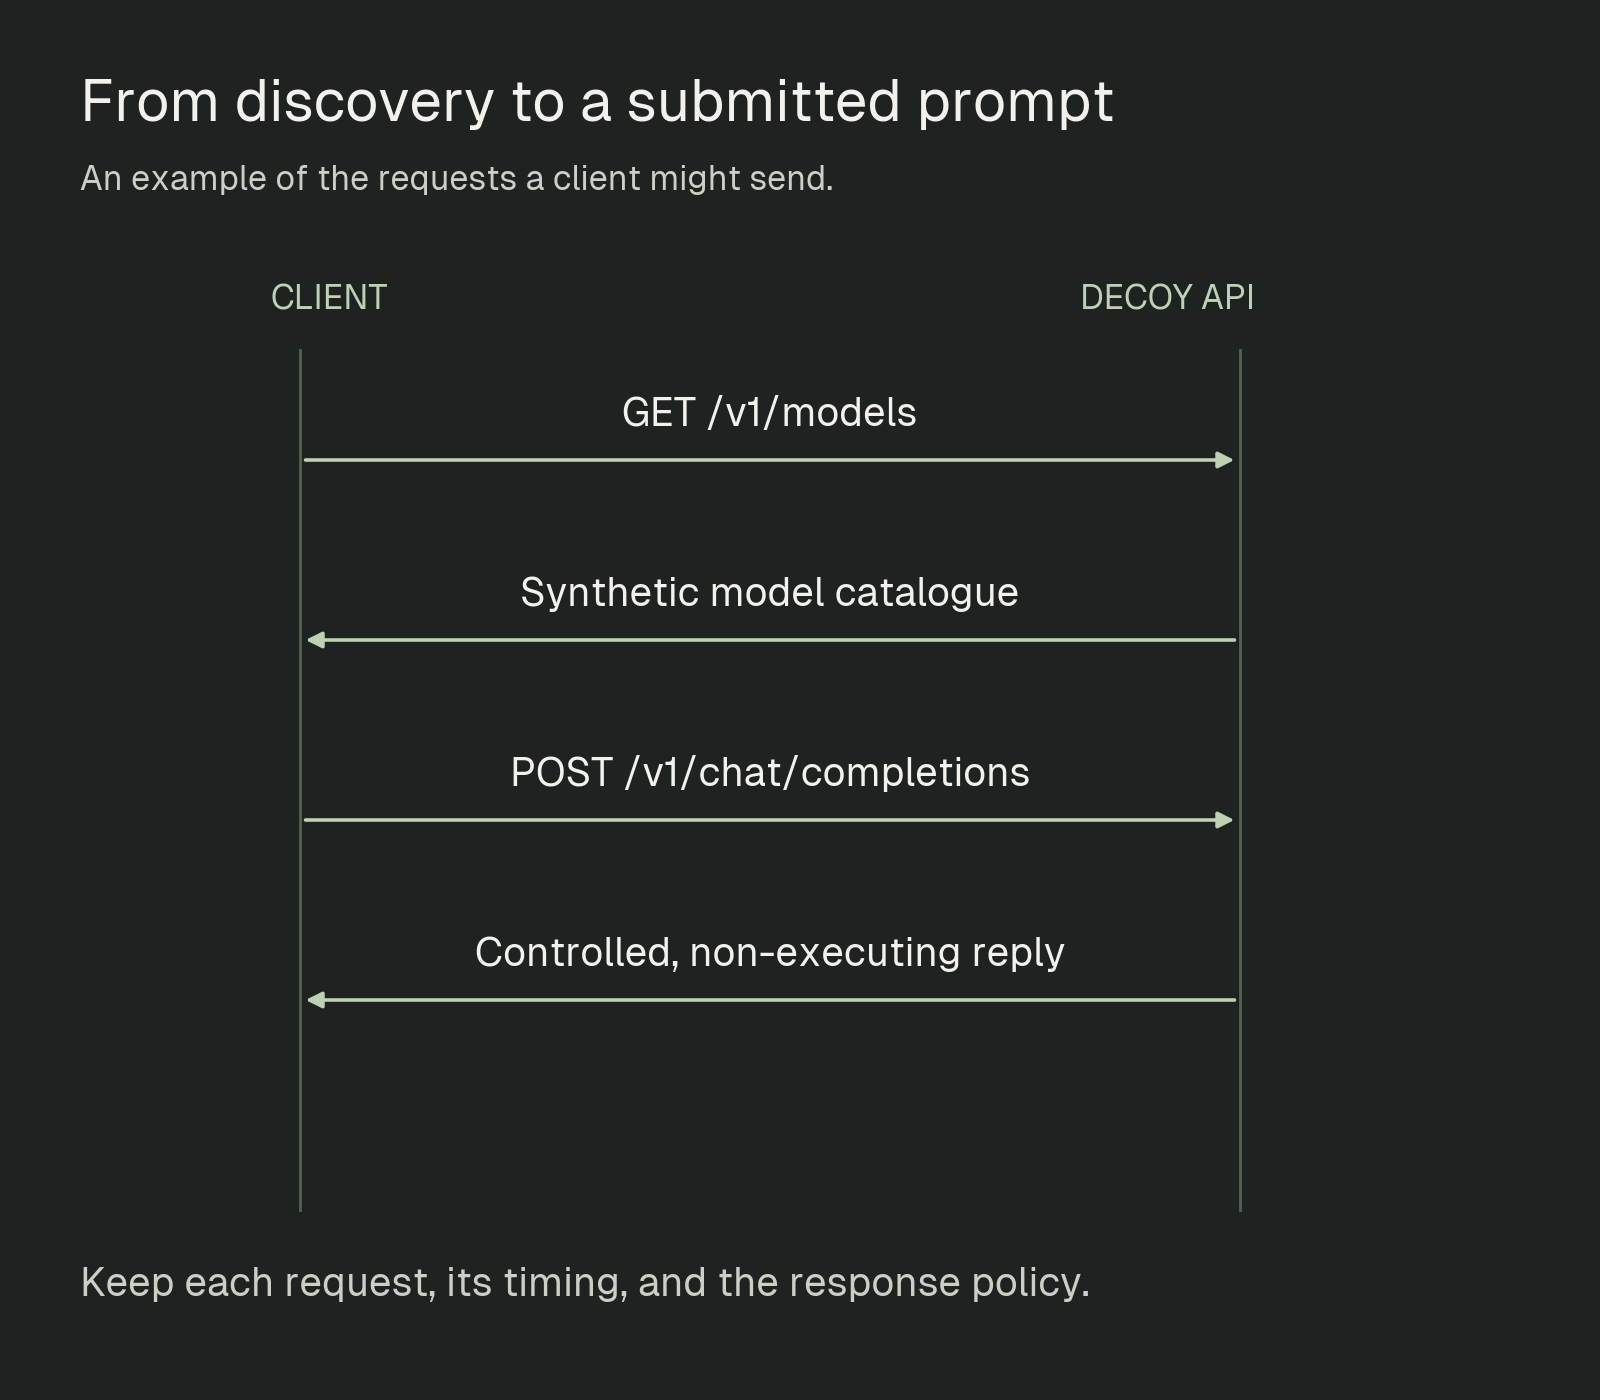
An illustrative sequence. Keep every request, its timing, and the reply policy you used.
MCP raises the stakes, because it is how many AI applications reach out to real files, databases, and internal APIs. An MCP decoy can record clients listing tools, reading a resource, or calling a tool, though seeing /mcp in a log is only the opening line: you need the request body to know which operation was asked for. (Some attacks never appear here at all, such as a malicious tool description shown to someone else's assistant, which we cover in the MCP tool poisoning post.) One discipline to adopt early: always log what your decoy chose to say back, and remember that a model name in a request is just what the client asked for, not proof of what answered.
How ai-honeypots.com works#
Picture the project as three separate jobs. The decoys are what internet visitors interact with. The recording and public views store and summarize those interactions. And the investigation layer is the workbench Eli and I built to chase a lead without copying it between five tools. Keeping them separate matters: opening the public dashboard does not send an attack to a honeypot, and looking up an address in our IOC Explorer does not make a honeypot reach out and touch it. Reading about activity is not the same as generating it.
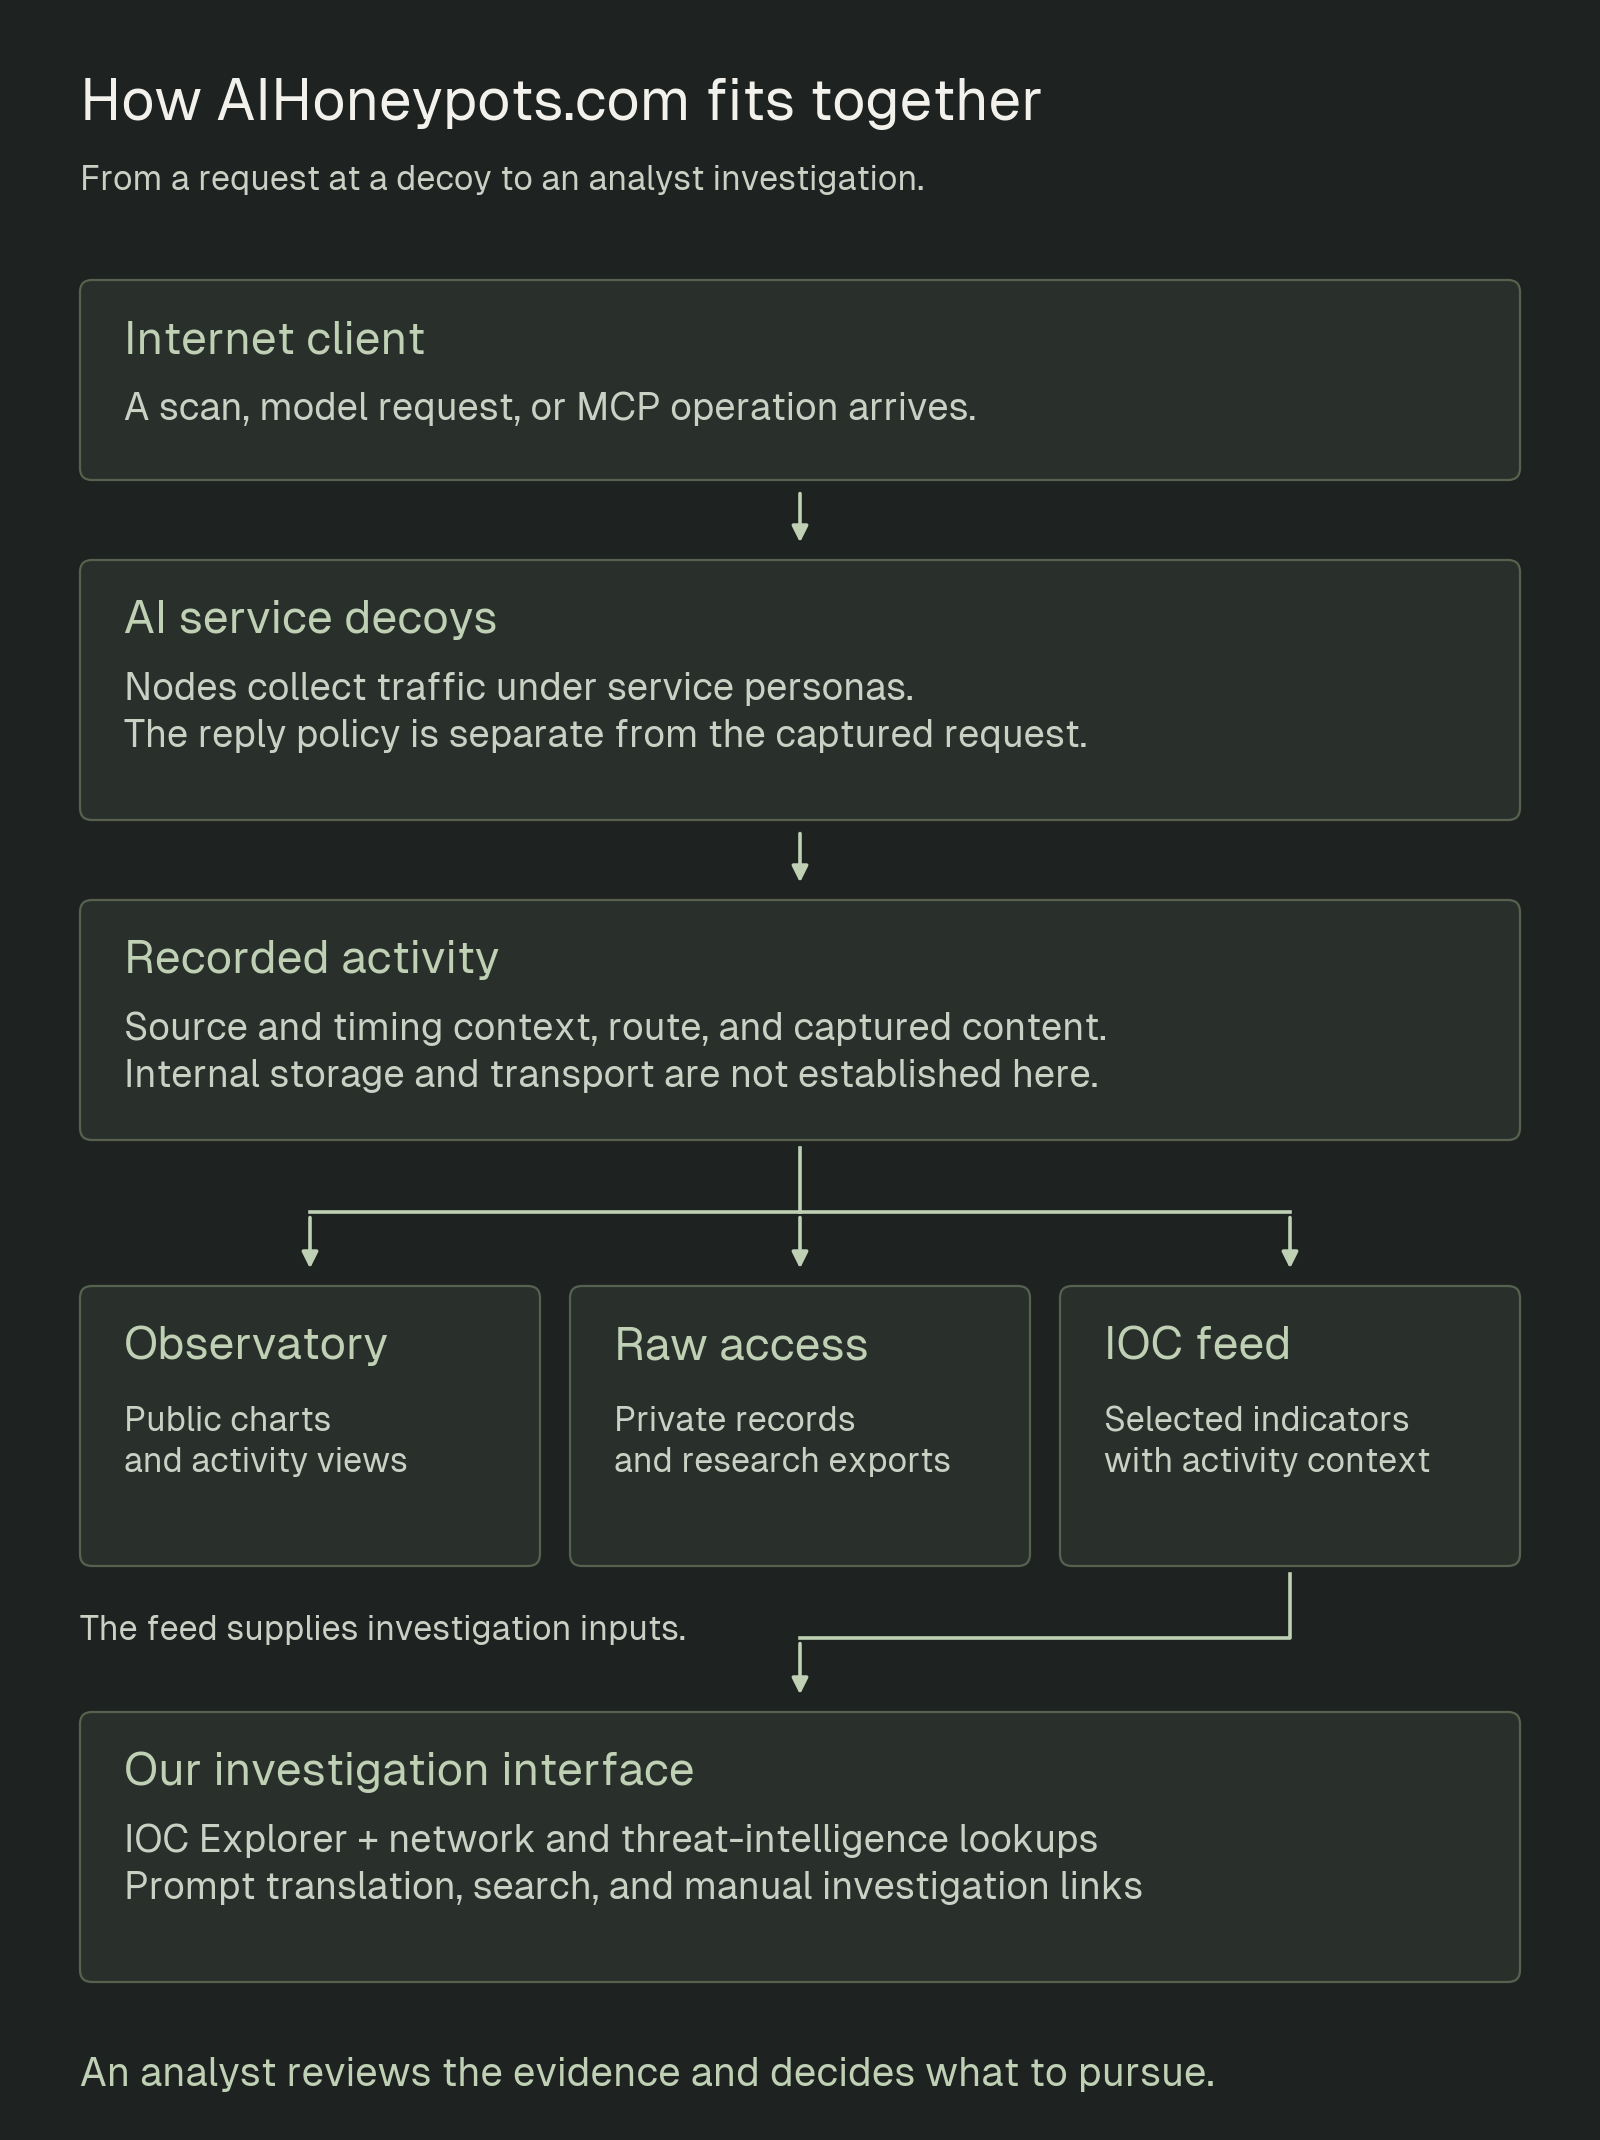
How the pieces connect, based on the public interfaces and our research material. The arrows show information flow, not a claim about the production database or hosting.
The network presents itself as several kinds of model-serving software (Ollama, LiteLLM, OpenAI-compatible, and LM Studio), so a scanning client recognizes something familiar and tries it. Once requests are recorded, four views serve four different needs, and confusing them is a classic way to double-count. The public observatory shows charts and summaries; the authenticated raw access holds the individual records with their content; the public IOC feed publishes selected indicators with hit counts and labels; and our investigation layer puts the feed, enrichment, and prompt search in one place. They are not four copies of one dataset: a single source can send twenty requests, which the raw archive holds as twenty records but the feed might summarize as one indicator with a hit count of twenty, so the two counts should never be added together.
One line to carry through the rest of this post: recording a request does not mean carrying it out. If a client asks an MCP decoy to read a file, the capture proves what was asked. To know what the service actually returned or did, you need the outcome evidence, separately.
Building your own: three levels#
The best way to understand honeypots is to run one. Start with a question you can actually answer, and let the question decide how much sensor you need.
Level 1: log which routes get scanned#
The simplest useful sensor is exactly the open-source Holiday Honeypot: nginx in several regions that answers "not found" to everything and writes one JSON line per request. Its scope is deliberately narrow, and the README says so plainly: "Just URI telemetry + source IP + timestamp + UA." Its deploy scripts stand up the edge nodes and a collector running Loki and a Grafana dashboard that charts requests per second by region and surfaces the rare URL prefixes seen only once or twice in the last hour. The heart of it is a log_format block and a server block whose only job is location / { return 404; }, logging fields like the source address, method, URL, and user-agent as JSON.
Two habits from the repo are worth copying: keep these logs private, since full URLs can carry secrets in their query strings, and do not turn every address and path into a searchable label in Loki, which would melt your storage. The Holiday Honeypot labels only the first ten characters of each path and parses the rest at query time, exactly the cardinality discipline Grafana recommends.
Now the crucial teaching point, and the reason this design is the start of the story and not the whole of it: a 404 logger can never capture a prompt. It records the route and moves on before the request body is ever read. The prompt-rich data behind the second post comes from a more advanced sensor that deliberately reads the body and answers like a model. That is Level 2.
Level 2: accept a prompt and return a fixed reply#
To see prompts, you need a decoy that speaks a model API. We include a small local Python decoy that runs without an API key, without a model, and without risk, because it binds only to your own machine. It implements two routes: GET /v1/models returns a made-up model called decoy-local, and POST /v1/chat/completions records a size-limited submission and returns a fixed research-decoy message.
Run python local_decoy.py, then from a second terminal:
curl http://127.0.0.1:8088/v1/models
curl http://127.0.0.1:8088/v1/chat/completions \
-H 'Content-Type: application/json' \
-d '{"model":"decoy-local","messages":[{"role":"user","content":"hello from the lab"}]}'Open the file it writes, lab-captures.ndjson, and compare each line with what you sent. You will see the peer address, the path, the messages, and the requested model. Notice one deliberate choice: authentication headers are recorded only as a yes/no "was one present," never with their values, because capturing a real credential is a liability you do not want. The example never sends the text to a model, never calls a tool, never follows a URL. You can inspect exactly what a visitor asked for without ever doing what they asked. Python's own http.server docs tell you not to run it in production, and they are right: a real internet-facing sensor needs a proper server, log rotation, resource limits, and isolated hosting.
Level 3: hold a longer conversation#
If your question needs more than one exchange, build a consistent persona: decide which routes it supports, which model names it claims, and how it handles errors, then version that behavior so you know exactly when it changed. An MCP decoy can hand back made-up resources and stubbed tool results, and the rule that keeps you safe is simple: a request to read a file must stay a recorded request, never an actual file read on the sensor. The same goes for any command passed as a tool argument.

A sane layout. Captured requests stay inside the collection boundary; the analyst works from a copy.
Across all three levels the hygiene is the same: keep management access separate, make sure the decoy cannot become a relay for outbound abuse, and write down the date every time you add a region or change a reply. Those dates are what let you explain a sudden jump in a traffic graph six weeks from now.
From a pile of logs to a finding someone can use#
Collecting is the easy half. The valuable half is turning a list of addresses into something a person can decide on, because a list of IPs is not intelligence. Intelligence answers a question someone actually has. So start with the question. For a team running an AI gateway, a good one might be: are visitors moving from just discovering our service to actively trying to read our configuration or connected data? That question tells you what to collect and what to do with the answer (it is the same instinct behind FIRST's guidance on priority intelligence requirements).
The workflow below runs from a captured request to a finding and back again. The diagram carries all nine stages; a few habits make each one honest.
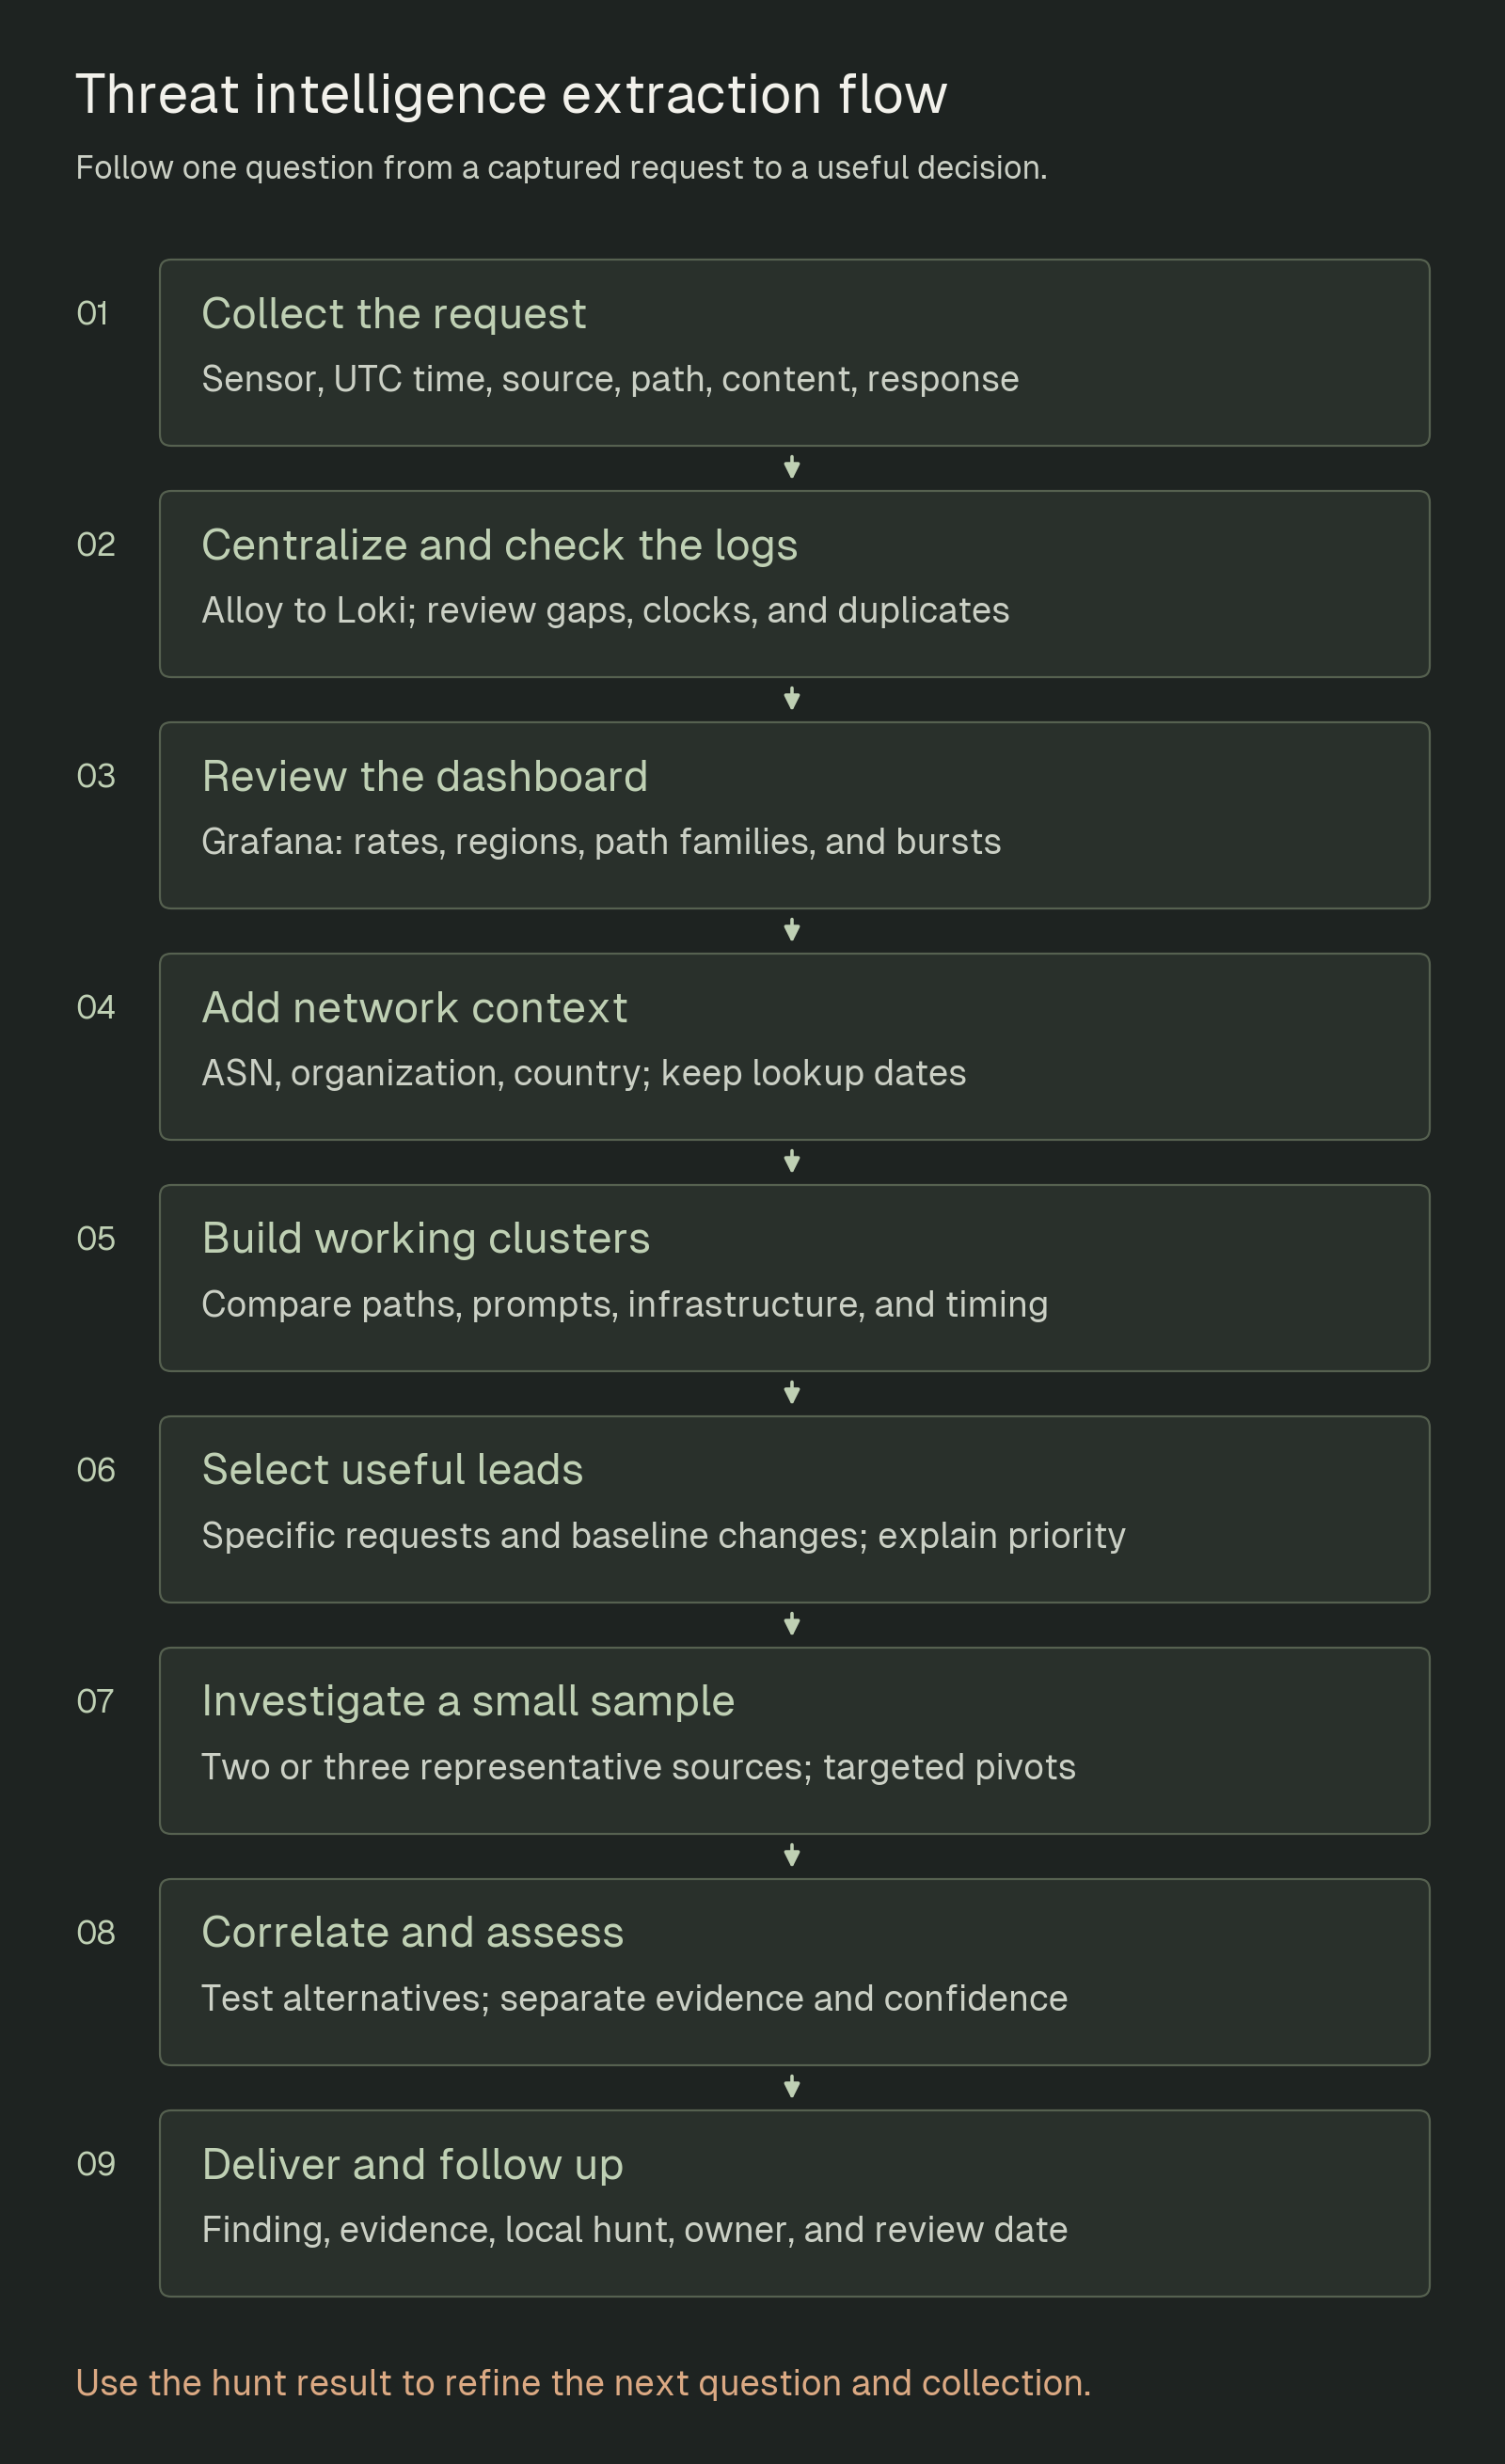
Start with a question, finish with a finding someone can act on, then feed the result back into the next question.
Collecting and grouping. Capture the content and the reply, not just the route, and check the boring failures that quietly ruin analysis: duplicate delivery, disagreeing clocks, a late batch that looks like a fresh burst. Keep three lookup outcomes distinct when you enrich (a failed lookup, one that found no match, and one that found something), and when you group events into a hypothesis, watch the traps: one country does not mean one operator, one cloud provider does not mean one tenant, and a rare path is not automatically an exploit. Remember too that "first seen" only ever means "first seen in the data you searched."
Investigating and delivering. A specific request repeated across several sensors is worth more than a thousand generic checks, so keep the reason you picked each lead and pivot on a small representative sample (VirusTotal and friends). Write the observation before the inference and try to break your own story: "three sources sent the same unusual sequence" is an observation, "they are probably one operator" needs far more, and you can be sure of a recorded sequence while staying unsure of intent. Then hand the reader a short finding, the supporting events, the time window, and one concrete next step, with a review date on every indicator so it does not calcify into a permanent block long after it stopped mattering.
What a good handoff actually looks like#
Here is a fictional example of the output (not a real finding from our archive). Three sources, seen by two sensors inside a 30-minute window, ask for a model catalogue and then request the same configuration path. The sensors returned only synthetic or not-found responses.
| Part of the handoff | Example |
|---|---|
| Finding | Several sources followed model discovery with requests for the same configuration location |
| Evidence | Internal event IDs, UTC times, requested paths, the recorded replies, and the grouping rule |
| Assessment | The sequence looks like a shared probing routine. An opportunistic hunt for credentials is plausible |
| Confidence | High in the recorded sequence; moderate in the shared-routine read; intent and ownership unresolved |
| Alternatives | A public scanner template, or an authorized assessment, could produce identical requests |
| Impact | No secret was disclosed in the decoy replies. Impact on any real service is unknown |
| Local hunt | Search gateway logs for the same sequence and confirm whether that location could expose a real secret |
| Next review | The gateway owner reports back within one working day; reassess before extending any temporary control |
A response status alone does not establish exposure. A honeypot returning a cheerful "success" does not prove the requested action happened. That gap, between what was asked and what actually happened, is the whole discipline in one sentence.
Making an interesting address easy to investigate#
In the early days, whenever an address looked interesting, we had to lift it out of the platform and check several external sources by hand. So we built an enrichment layer to gather that context in one place: Team Cymru and RDAP for network and registration, reverse DNS for hostname clues, Shodan InternetDB for previously-seen services, ThreatFox and URLhaus for reputation, and VirusTotal as a manual pivot. Each has limits (an ASN identifies a network, but a shared host can have thousands of unrelated customers), so we keep the time and result beside every source rather than flattening them into one verdict.

The IOC Explorer joins the feed and the enrichment. Sorting by one kind of match floats a lead to the top; it does not make the top row the most dangerous source.
Keeping each source's result visible matters most when they disagree. In the detail view below, RDAP returned an error (no registration result), Shodan InternetDB and URLhaus found nothing, and ThreatFox returned two matches labeled botnet command-and-control. Those are three different things: information unavailable, a lookup with no match, and a reported association worth investigating. The reverse-DNS result says "not confirmed," because a hostname is a clue, not an identity, and a ThreatFox match does not prove this visitor operated the named malware.
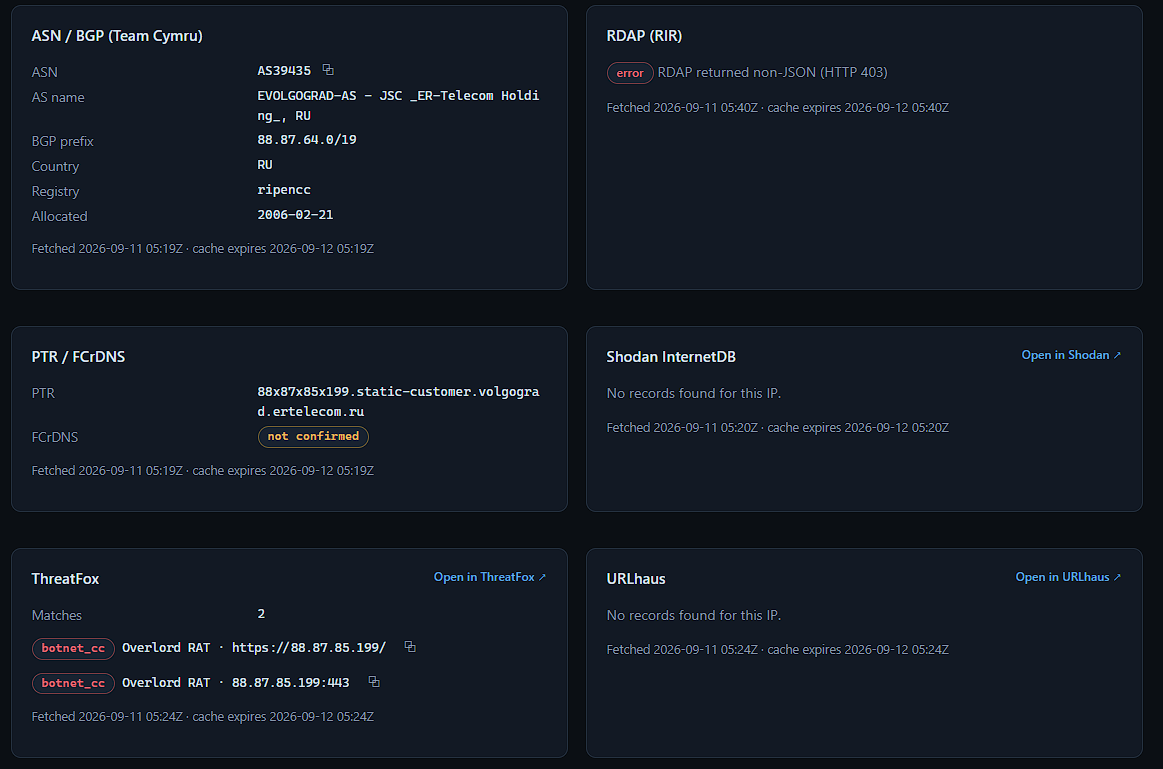
One address's enrichment as captured during the research, with pivots into VirusTotal, Shodan, Censys and the rest one click away. These are dated source responses, not a statement about the address today.
If you build your own version, our IPinfo enrichment script shows the pattern in miniature: it takes a token from an environment variable, validates that an address is public, and caches results for an hour.
Reading the prompts, and finding related activity#
The prompts are usually where the more interesting clues live. A good chunk of the traffic is not in English, so we added translation next to the original text. Keeping both visible is not a nicety: a translated technical term or a shifted punctuation mark can change how you read a request.

Original text stays beside the translation. The highlighted values are search pivots into other captured text.
Captured traffic often looks exactly like ordinary work, because sometimes it is. Two cautions keep you honest. A message that says it read a file is still just a submitted message, not a server-side execution log, and a mention of /v1/models inside a prompt is not proof the client requested that HTTP route. And the rule that never bends: extracting a URL does not mean fetching it, so keep captured material away from anything that executes and give any model you use for translation or triage no tools it could abuse (we dig into that in the agent memory security post).
To connect related activity, start with the cheapest match and loosen from there: hash the exact text and count where it reappears, then separately try removing superficial differences or matching a template with changing values. Each step outward buys more matches but demands more checking. A score of 1.000 on a similarity panel is not a probability that two requests share an attacker; check the source addresses, event IDs, and timestamps first.
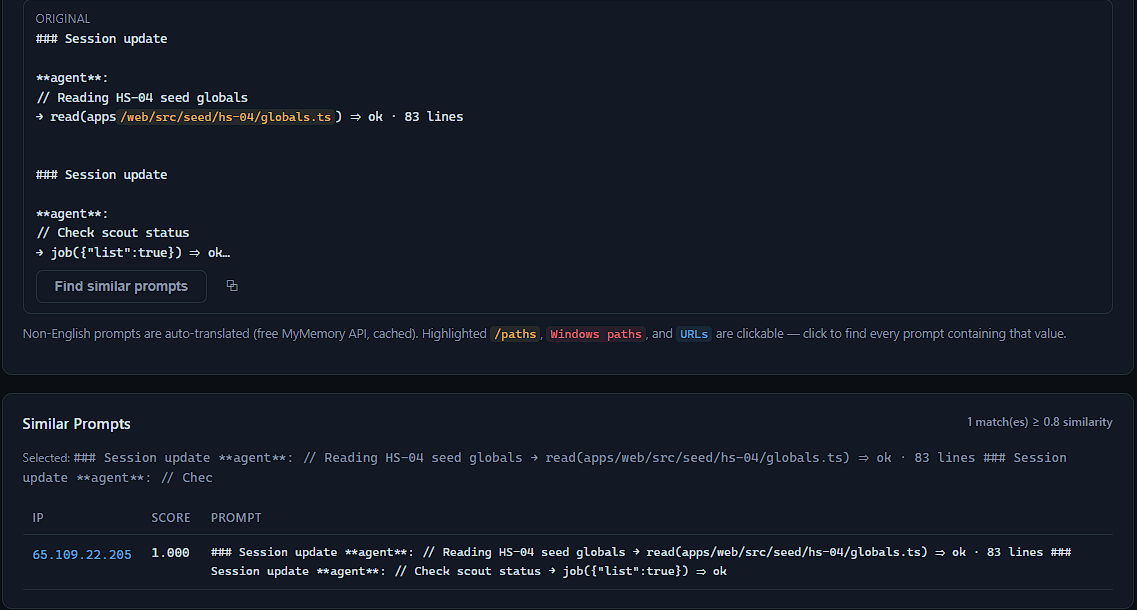
Broader matching finds more, but each level out needs more checking before you connect the activity.
A single search box ties it together, with the field being searched made explicit, so one query can pivot from an address to an ASN to prompt text to a targeted route:
8.8.8.8 AS16509 keyword:"system prompt" endpoint:/v1/modelsTwo sources saying "hello" give us almost nothing. Two sources sending the same unusual multi-line prompt, in the same order, at similar times, give us a great deal.
Where to start#
Begin with one isolated sensor and a question you can answer. Send your own harmless requests first, confirm the records are complete, and make certain the decoy cannot reach production resources or act as an outbound relay. The open-source Holiday Honeypot is a good Level 1 starting point and the local Python decoy above is a good Level 2 one, but set your limits and retention before you collect broadly. Two exercises then reveal more about the quality of your setup than adding nodes ever will: can you fully explain your largest burst of traffic, and can another person reproduce your daily counts from the raw data? For a security team, the real next step is to hunt for the same behavior in your own gateway, proxy, and application logs. A honeypot observation is a lead; your own events are what tell you whether the same activity reached you.
That is where the value compounds. The companion post shows why: most of the sheer volume in our archive turns out to be repeated boilerplate, while a few small, specific groups of requests carry almost all of the real signal.